Businesses generate a lot of information due to sales, customer interactions, accounting, inventory management, operations, etc. Nevertheless, it is not enough to collect the data; it is crucial for organizations to know what it is and how it can be used when making business decisions. Microsoft Dynamics 365 and Power BI provide such options.
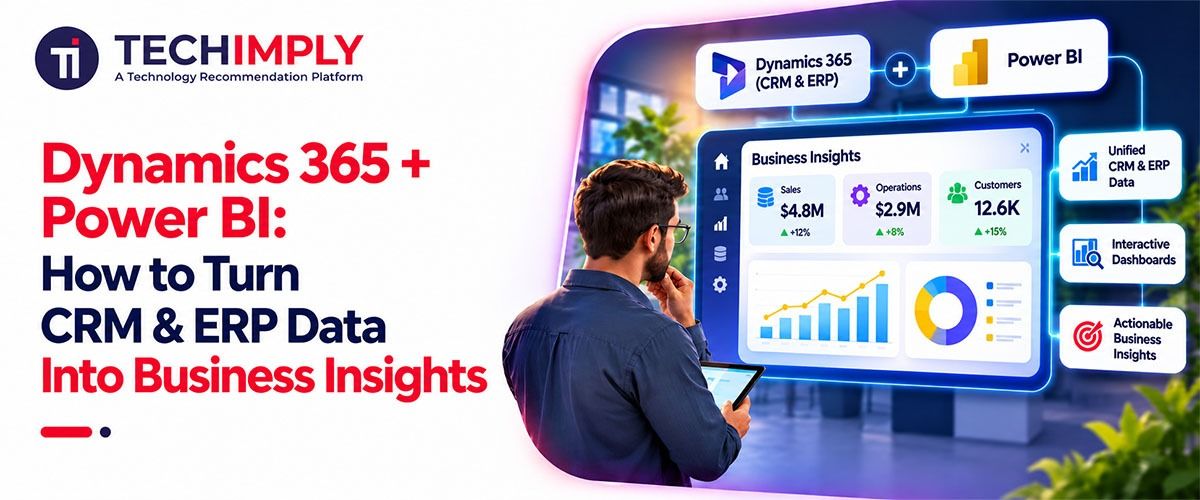
The tool Microsoft Dynamics 365 helps businesses organize their CRM and ERP operations, while Power BI can help them analyze business data in the form of dashboards, reports and insights. Integration of both tools will give businesses the opportunity to evaluate their performance, discover new opportunities and use data for decision making.
Integration of Microsoft Dynamics 365 and Power BI gives a chance to gather all business information concerning customers, finances, operations and other aspects of business in one place. The current paper will discuss in detail the possibilities of such integration, its benefits, practical examples of usage and advantages for business.
What Is the Role of Dynamics 365 in Business Data Management?
Microsoft Dynamics 365 is a series of business applications that assist in managing customer relationships and enterprise functions. This solution integrates CRM and ERP functionalities to enable organizations to effectively manage their business processes.
The CRM applications of Dynamics 365 are responsible for managing leads, sales opportunities, customer service, and marketing efforts, while the ERP applications cover finance, supply chain, inventory, project management, and other operations.
Some of the data collected by Dynamics 365 includes:
- Details about customers and interactions
- Sales opportunities and sales status
- Purchase orders and vendors
- Financial data and expenses
- Inventory quantities and warehouse operations
- Customer service inquiries and resolution times
- Employee and project performance data
While Dynamics 365 provides report generation capabilities, companies requiring advanced data visualization and analysis capabilities would require something more. Power BI meets this requirement.
How Does Power BI Turn Dynamics 365 Data Into Business Insights?
Microsoft has created Power BI, which is a data analysis tool. This program connects different sources of data, organizes the data, and presents the data in the form of interactive reports and dashboards. When combined with Dynamics 365, Power BI assists businesses in analyzing data from CRM and ERP systems without having to prepare multiple spreadsheets.
The following steps usually need to be done:
1. Connect Dynamics 365 To Power BI
The first thing you will have to do is connect your necessary Dynamics 365 applications and data sources to Power BI. Businesses can choose from various methods of connection based on the application and reporting needs. For instance, a sales department can connect data from Dynamics 365 Sales, and the finance department can connect their financial data from Dynamics 365 Finance.
2. Preparing and Organizing Business Data
The business data normally emanates from various departments. Before developing a report, the data should be cleaned, transformed and organized. The power query in the Power BI will help eliminate duplicates, formatting errors, merging of the datasets and organizing the data for analysis.
3. Developing a Data Model
The data model is developed to link related data from various sources within the business environment. This means that the customers' information could be linked to purchases, invoices and any other requests made. Power BI uses the relationships, calculated columns and DAX measures.
4. Creating Interactive Dashboards
Once data models have been developed, it is easy for firms to create their dashboard and reports visually by way of graphs, charts, tables, etc. Management can also filter data based on departments, regions, products, salesmen, or even any time frame to generate reports.
5. Sharing Reports & Monitoring Business Performance
Power BI provides an organization the ability to publish their reports and then distribute them to the authorized users using the Power BI Service.
Key Business Insights You Can Generate Using Dynamics 365 and Power BI
The use of Dynamics 365 and Power BI together gives great insights into various business departments.
1. Sales Performance Insights
Power BI can be used by the sales department for analyzing data provided by Dynamics 365 Sales, and getting an understanding of how well their sales efforts are going.
Businesses can measure:
- Revenue and growth per month
- Conversion rate of leads
- Pipeline value
- Performance of the sales people
- Win or lost deals
- Deal closing times
Such insights will enable sales managers to understand which areas need improvement.
2. Financial Insights
With Dynamics 365 Finance, it is possible to create financial and accounting data that can be utilized by firms for reporting purposes through Power BI.
The Finance dashboard can show the following data points:
- Inflow and outflow
- Income statement and losses
- Trends in cash flows
- Payables and receivables
- Comparative budgeting against expenses
- Performance analysis department-wise
Finance managers can use this information to analyze their spending habits and profits.
3. Inventory and Supply Chain Insights
Inventory management is one of the main functions in manufacturing, distribution, and retail businesses.Together with the right data from Dynamics 365 Supply Chain Management along with Power BI, it will be possible to follow the status of the inventory, its movements, purchasing orders, and the suppliers' activity.
The dashboards will provide data about products, shortages, and purchasing patterns. This information will allow managing inventories more efficiently and save on storage costs.
4. Customer Service Insights
When businesses are employing Dynamics 365 CRM Solution, they can link service-related data to Power BI to get an idea about the performance of their support team.
Some examples of metrics that reports could cover include number of tickets, average resolution time, customer satisfaction, common complaints, and compliance with service level agreements.
Benefits of Integrating Dynamics 365 With Power BI
There are many benefits that come from integrating these platforms.
1. Decision Making
The Power BI platform allows managers to present business data through visual reports, which then help them make decisions about trends, comparison of performance and so forth.
2. Centralized Business Reporting
Information from various applications such as CRM, ERP and others can be aggregated within one reporting platform. There is no need to have multiple spreadsheet documents for various departments of the company.
3. Operational Efficiencies
Automatic creation of data connections and scheduled refresh can save time for report preparation and allow workers to analyze results.
4. Real Time or Near Real-Time Information
Depending on the chosen connection and refresh settings, the company can see the updates of the information at any point of time.
5. Interdepartmental Cooperation
Sales, finance, inventories, and other departments will be able to use common information for reports. It will help to see the impact that operations of departments have on the business performance as a whole.
Conclusion
In terms of how they are used together by businesses, it is fascinating to see Dynamics 365 coupled with Power BI. This is because Dynamics 365 holds important information about customers as well as operations, while Power BI allows us to make sense of data through dashboards.
Whether it’s analyzing sales performance or financial statements, providing customer support or managing inventory, this integration allows organizations to see how things stand in their business.
With the right kind of data integration, reporting structure, and dashboard development, companies will be in a better position to have increased visibility, reduced reporting time, and make more informed decisions. Working alongside a professional technology company like Tabdelta Solutions will also help in making Custom Dynamics 365 CRM Solution an easy task.