


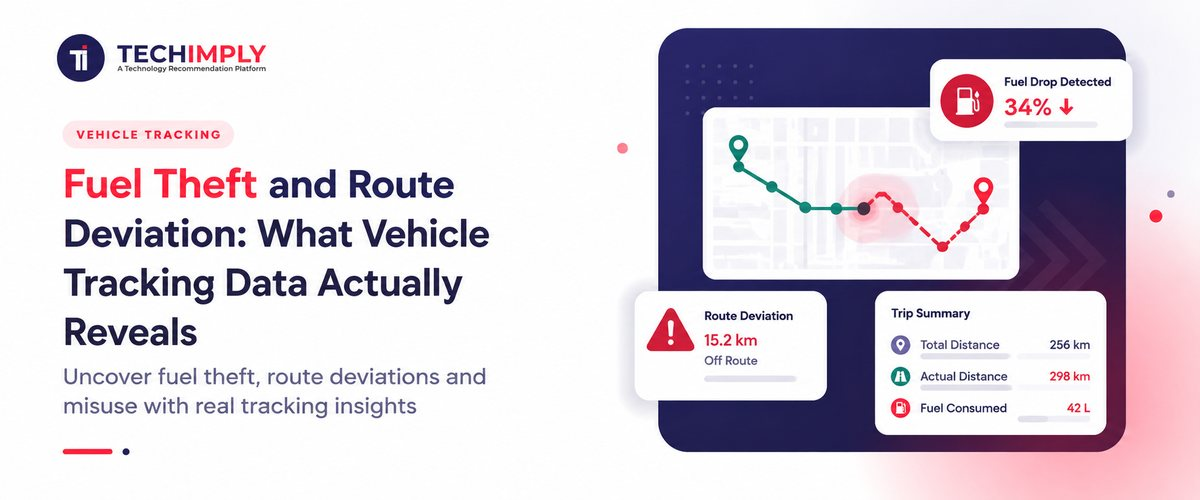
Fleet operators managing commercial vehicles across India confront a persistent problem that rarely appears in official records yet systematically erodes profitability. Fuel disappears from tanks without mechanical explanation. Vehicles take circuitous routes, consuming excess fuel. Drivers report arriving at destinations with fuel gauges reading differently than actual tank contents. These losses mount silently until an organisation reviews its fuel expenses against kilometres travelled and realises something fundamental is wrong.

Looking for a Vehicle Tracking System?
Check out Techimply's List of the Best Vehicle Tracking System in India for your business.
The financial dimensions are stark. A single commercial vehicle consuming Rs. 2,000 worth of fuel management daily might lose Rs. 5,000 to 10,000 monthly if fuel theft remains undetected. Scale this across a fleet of 50 vehicles and annual losses exceed Rs. 30-60 lakh, losses that directly reduce profit margins or necessitate raising prices that make organisations uncompetitive. Route deviations compound the damage by extending distances travelled, burning fuel for unauthorised routes, and creating cascading delays affecting schedules and workforce management.
What Is Fuel Theft in Fleet Management?
Fuel theft differs fundamentally from other forms of operational loss. Mechanical leaks emerge gradually, identifiable through maintenance inspections. Evaporation occurs predictably, factored into fuel accounting. Fuel theft represents deliberate removal of inventory management by personnel extracting fuel from tanks, selling it through unauthorised channels, or using it for personal purposes. The theft creates unaccountable private benefit while reducing fuel available for business operations.
The forms fuel theft takes reveal how drivers have refined theft into accepted practice. A driver stationed at a remote location during night hours might siphon fuel into containers, selling it the next day to informal fuel retailers who ask no questions about source. Another driver might coordinate with fuel depot attendants to record larger quantities of fuel being issued than actually delivered to the vehicle, with attendants and drivers splitting the difference. Still others might partially drain fuel before vehicle return, then claim the lower readings reflect highway consumption, diverting the actual fuel consumed through routes not travelled.
Identifying fuel theft requires understanding what normal consumption looks like. A vehicle manufacturer specifies fuel efficiency, perhaps 8 kilometres per litre for a particular commercial vehicle under standard conditions. This specification represents a baseline. When actual consumption drops to 6 kilometres per litre or lower, something has changed. Either the vehicle has developed mechanical problems requiring maintenance, or fuel is being diverted. An organisation not monitoring consumption patterns never recognises this deviation.
The economic incentives driving fuel theft are straightforward enough that ignoring them ensures the problem persists. A driver earning Rs. 20,000 monthly can supplement income by Rs. 2,000-3,000 weekly through fuel siphoning, a 10-15 percent income increase that many drivers consider compensation for low base wages and difficult working conditions. This isn't theft from the driver's perspective; it's compensation extraction from an organisation believed to be underpaying for the work required. Understanding this perspective explains why punitive approaches alone fail; they address symptoms rather than underlying incentive structures.
How Vehicle Tracking Helps Detect Fuel Theft
The technology infrastructure supporting fuel monitoring begins with sensors installed directly into vehicle fuel tanks. These sensors read actual fuel quantity- not the electronic gauge reading that drivers see, and that can be manipulated, but precise measurement of what's physically in the tank. The data streams continuously to tracking systems, creating running records of fuel quantity over time.
This fuel-level information becomes meaningful only when analysed against vehicle movement. A vehicle travelling 100 kilometres should consume fuel proportional to its specifications. If a vehicle tracking system shows 100 kilometres travelled but fuel consumption indicates 150 kilometres worth of consumption, the excess consumption signals problems. The vehicle might have mechanical issues. More likely, fuel is being extracted.
GPS tracking system data provides spatial context for consumption anomalies. Rather than simply seeing that a vehicle consumed excess fuel during a trip, GPS data reveals where that consumption occurred. A vehicle that consumed normal fuel while travelling from Delhi to Agra might show unusual fuel drops during a 20-minute stop at a remote location. This spatial specificity enables investigation to focus on particular locations where fuel extraction likely occurred, potentially identifying coordination with fuel theft networks operating at those points.
How GPS Tracking Detects Route Deviations
Authorised routes begin as management decisions about which paths vehicles should travel to accomplish business objectives. A delivery vehicle with scheduled stops in five locations should travel the most efficient route connecting those locations. This planned route becomes the reference point for evaluating actual performance.
GPS vehicle tracking records actual movement continuously, creating trajectory data showing precisely where each vehicle travelled. The comparison between planned and actual routes immediately reveals deviations. A vehicle that should have travelled directly from Delhi to Noida via the expressway but instead travelled via Gurugram, adding 30 kilometres to the journey, becomes apparent through GPS analysis. The deviation might reflect traffic avoidance- legitimate driver behaviour. Alternatively, the deviation might represent a personal errand or coordination with fuel theft networks.
Unauthorised stops show up in GPS data as pauses at locations not scheduled for business activities. A delivery vehicle with three scheduled delivery points should show three stops. If GPS data shows five stops, the additional two stops represent unauthorised pauses. These might be brief- a 10-minute break at a roadside restaurant. They might be extended- a two-hour personal task unrelated to business operations. They might be suspicious stops at locations known to host fuel theft operations.
What Vehicle Tracking Data Actually Reveals
Fuel consumption patterns tell stories when data is examined systematically. A vehicle might show normal consumption throughout the day except for a sudden 15-litre drop during a 10-minute stop at 2 AM at a remote highway location. This pattern strongly suggests fuel extraction at that location. The vehicle tracking system creates an objective record: on this date, at this time, at this location, fuel disappeared without corresponding vehicle movement.
Route deviation patterns emerge from GPS data when examined across weeks. A vehicle consistently taking longer routes than planned, adding 20-30 kilometres to journeys despite identical cargo and destination, suggests systematic deviation. The deviation might reflect driver preference for particular routes, or might reflect coordination with fuel theft operations located along those routes. Extended investigation determines which.
Idling data reveals fuel consumption during stationary periods. Commercial vehicles idling for four hours consume 12-15 litres without moving. An organisation monitoring GPS tracking system data can distinguish between legitimate rest stops necessary for driver safety and rest periods extending unnecessarily long, consuming fuel without business justification.
How to Investigate Suspected Fuel Theft
Investigation of suspected fuel theft requires methodical examination of accumulated data. A single anomaly might reflect operational circumstances. Consistent patterns over weeks indicate systemic problems. Fleet managers should review fuel records across extended periods- minimum four weeks, ideally eight weeks- to establish whether consumption anomalies are occasional or consistent.
GPS history provides crucial context. When fuel-level data shows unusual consumption at specific times, GPS records answer the question: where was the vehicle? A vehicle showing fuel loss while GPS data indicates it was at an authorised customer location likely has mechanical issues or is being used differently than reported. A vehicle showing fuel loss while GPS indicates it was at an unauthorized location suggests fuel theft. A vehicle showing fuel loss while GPS indicates it was stationary at a remote location overnight suggests fuel extraction.
Odometer readings cross-referenced against GPS distance data reveal discrepancies indicating problems. If GPS tracking system data shows a vehicle travelled 500 kilometres while the odometer shows 400 kilometres, something is wrong; either GPS is malfunctioning, or the odometer is tampered with. Conversely, if both sources agree on 500 kilometres but fuel consumption indicates only 300 kilometres worth of travel, fuel is clearly being diverted elsewhere.
How to Prevent Fuel Theft and Route Deviations
Prevention begins with real-time visibility. A vehicle tracking system configured to alert management when fuel-level sensors detect rapid fuel consumption enables supervisors to contact drivers immediately when suspicious activity occurs. Rather than discovering fuel losses after they accumulate, real-time alerts enable intervention within minutes of problems appearing. A driver receiving a call from a supervisor asking why fuel is disappearing from their vehicle at 2 AM stops the activity.
Geofencing creates preventive barriers by restricting vehicles to authorised areas. A commercial vehicle geofenced to operational territories cannot travel outside those areas without triggering alerts. This prevents extended unauthorised journeys where fuel theft might occur. A driver knowing they cannot travel beyond geofence boundaries without immediate supervisor notification behaves differently than a driver with unlimited route freedom.
Regular analysis of vehicle tracking system data maintains continuous awareness. Daily review of fuel consumption data, route compliance, and vehicle locations enables early identification of problems. A vehicle showing consumption 15 percent above specification becomes apparent within days of regular monitoring, enabling investigation before months of theft accumulate. Weekly trend analysis reveals patterns that daily views might miss- a vehicle averaging excess consumption across the entire week, for instance.
Driver communication addressing vehicle tracking system capabilities influences behaviour. When drivers understand that fuel consumption is monitored, routes are tracked, and anomalies are investigated, they modify behaviour accordingly. Communication should explain the business rationale: fuel theft reduces competitiveness, necessitating price increases affecting everyone rather than framing it as punitive surveillance. Drivers are more likely to comply when they understand the stakes.
Conclusion
Fleet operations across India experience substantial losses to fuel theft and route deviations that remain invisible without systematic monitoring. A vehicle tracking system transforms these hidden costs into manageable problems by creating visibility into actual operations compared against planned activities and established performance baselines. The integration of fuel-level monitoring with GPS tracking capabilities enables identification of fuel theft patterns and route deviations within hours rather than discovering them through accounting analysis weeks later. This rapid identification enables responsive management addressing problems before they compound into major financial losses.