GraphPad Prism

Analyze, graph and present your scientific work

0.0
Rating out of 5 Based on 0 reviews

What is GraphPad Prism?

GraphPad Prism is a powerful prism software designed for scientific data analysis, graphing, and statistical modeling. It is widely recognized as one of the most reliable data visualization software tools in research environments. Prism combines the capabilities of prism statistical software with advanced data management and visualization options, making it ideal for biologists, medical researchers, and laboratory teams. This tool is especially popular for producing publication-ready graphs, performing automated prism analysis, interpreting complex datasets, and improving workflow accuracy. Whether users need basic curve fitting or advanced regression modeling, prism graphing software delivers clear, reproducible results.

Pricing of GraphPad Prism

no-pricing
For get detailed pricing as per your requirements.

Key Features of GraphPad Prism

Key Features:
  • Quantitative Analysis
  • Text Analysis
  • Annotations
  • Multi-Language
  • Qualitative Comparative Analysis
  • Sentiment Analysis
  • Statistical Analysis
  • Collaboration Tools
  • Data Import/Export
  • Mixed Methods Research

Key Specification

Other Categories: Qualitative Data Analysis Software Graph Database Static Code Analysis Tools
Deployment: Cloud Hosted,Hybrid
Customer Support: Phone,Email,Live Chat,Online (Ticket)
Customization: Yes
Languages Support: English

Who uses GraphPad Prism

StartUps
StartUps
SMEs
SMEs
Agencies
Agencies
Enterprises
Enterprises

Company Details

Company Name: GraphPad Prism
Headquarter: San Diego, California United States
Social Media:

GraphPad Prism Description

Who Uses GraphPad Prism?

GraphPad Prism is used by:

  • Academic researchers

  • Pharmaceutical and biotech scientists

  • Healthcare and clinical research teams

  • Laboratory analysts

  • Students in biological sciences

  • Professionals working with statistical modeling

Users who require quick and precise graphing, statistical interpretation, and automated calculations often prefer Prism over prism bill pay alternatives or simpler graphing tools.

Why Choose GraphPad Prism?

Organizations choose Prism because it blends statistics, graphing, and data analysis into one platform. It reduces manual work, eliminates calculation errors, and supports high-quality research outputs. Its intuitive interface makes complex statistics approachable even for non-statisticians.

Benefits of GraphPad Prism

  • Easy-to-understand statistical analysis

  • Automated calculations and regression

  • Publication-quality visualizations

  • Faster research workflows

  • Built-in scientific graph templates

  • Clear interpretation of results

  • Professional-grade statistical accuracy

Features of GraphPad Prism

  • Advanced curve fitting

  • Comprehensive prism analysis tools

  • Dozens of scientific graph types

  • Automated data organization

  • Built-in statistical tests

  • Customizable chart and graph layouts

  • Step-by-step statistics explanations

  • Import/export for major data formats

How to Use GraphPad Prism?

Using Prism typically involves:

  1. Importing or entering datasets in structured tables.

  2. Selecting statistical tests based on experiment type.

  3. Running automated calculations using prism statistical software tools.

  4. Creating graphs through drag-and-drop options.

  5. Exporting graphs for publications or presentations.

  6. Comparing multiple datasets using built-in analysis workflows.

GraphPad Prism Demo

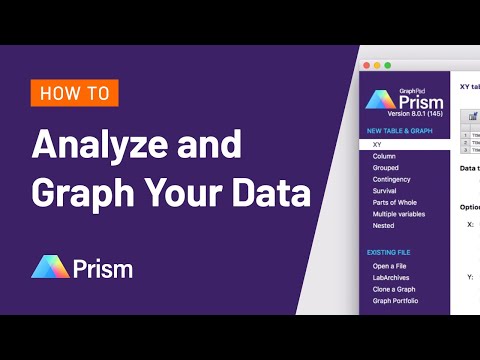
A Prism demo usually includes a walkthrough of dataset entry, running statistical tests, generating visual graphs, and customizing results. It also demonstrates how researchers use Prism to simplify experimental workflows.

GraphPad Prism Pricing

Pricing varies depending on academic vs. commercial plans. Many users compare graphpad prism software price options before purchasing. The graphpad prism cost generally depends on license type, subscription duration, and the number of users.

GraphPad Prism Review

Users appreciate Prism for its reliability, accuracy, and graphical output quality. Many reviews highlight that prism graphing software reduces the complexity of data analysis and helps publish-ready research visuals. The tool is highly rated for ease of use, though some note that advanced statistical features take time to master.

Alternative

Visual Expert

By Visual Expert

0.0
Rating out of 5 Based on 0 reviews

Codiga

By Codiga

0.0
Rating out of 5 Based on 0 reviews

DeepSource

By DeepSource

0.0
Rating out of 5 Based on 0 reviews

GraphPad Prism Video/Screenshots

GraphPad Prism Key Clients

User Reviews

no-reviews
Share your experience! Be the very first reviewer. Write a Review

Frequently Asked Questions (FAQs)

The user group of GraphPad Prism are as follows :

  • Startups
  • SMEs
  • Agencies
  • Enterprises

GraphPad Prism has 0 plans.

GraphPad Prism is not allowing Free Trial.

GraphPad Prism pricing model : Yearly,Monthly

GraphPad Prism is Cloud Hosted,Hybrid Software.

Yes

GraphPad Prism offers Phone,Email,Live Chat,Online (Ticket) support.

GraphPad Prism provides Help Guides,Blogs for the software training.