

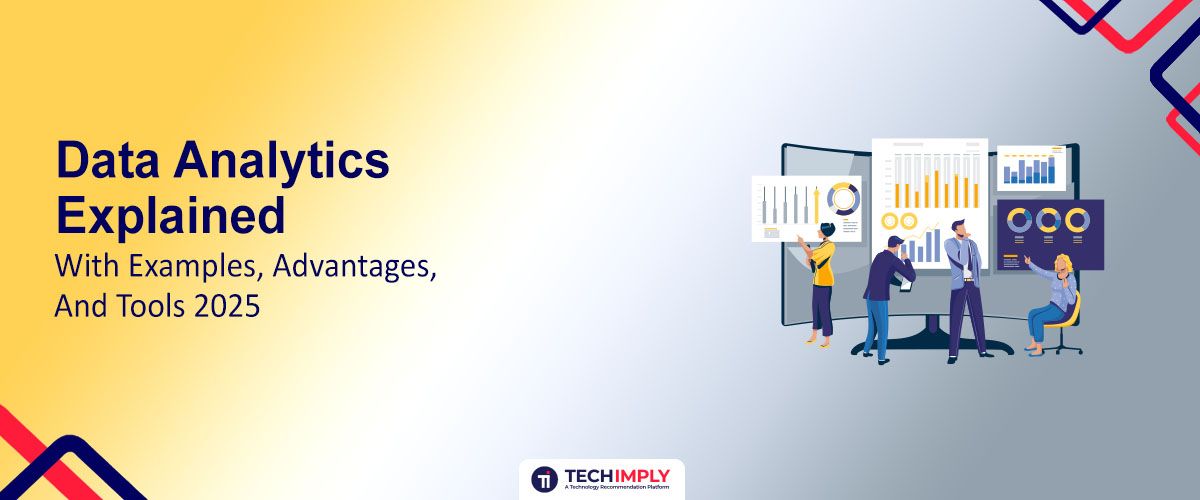
If there is one thing today’s businesses cannot afford to ignore, it is that. Every click, purchase, conversation, delay, delivery, and interaction is constantly generating information. The organizations winning today are not the ones with the most data — they are the ones who know how to analyze, interpret, and act on it. That’s where data analytics comes in.

Looking for Qualitative Data Analysis Software?
Check out Techimply's List of Best Qualitative Data Analysis Software in India for your business.
Data Analytics is no longer a niche function for the IT department; it is the core strategic engine for every successful organization. It transforms noise into actionable insights, helping leaders make better decisions, faster.
Are you harnessing the full power of your data? In this article, we will break down the essential process, explore the immense benefits, and detail the most common tools for data analysis that are shaping the future.
What Is Data Analytics?
Data analytics is the practice of collecting, processing, and analyzing raw data to uncover valuable insights. These insights help businesses make better decisions, optimize processes, and predict future trends. Many confuse what data analytics is with basic reporting, but analytics goes much deeper.
Unlike a simple report, data analytics answers questions such as:
- Why did sales drop last month?
- Which products work best in a specific region?
- Which marketing channel gives the highest return?
- What is data analysis in research, and how does it support outcomes?
In short, data analytics means evolving around transforming raw numbers into meaningful information that supports decisions.
Here’s a reference that explains the need for data analytics in simple terms:

Source: Quora
What Is The Data Analytics Process?
Effective data analysis is a systematic process, not a chaotic hunt for answers. Understanding the stages of data analysis is crucial for generating reliable results.
1. Data Collection
The first step is the collection of raw data in different sources: internal databases, customer relationship management (CRM) systems, external market reports, and social media logs. The output of quality is directly dependent on the quality of this input.
2. Data Cleaning And Preparation
It is, perhaps, the most time-consuming step. Raw data is sloppy; it contains mistakes, repeats, missing data points, and erratic formats. Data preparation comprises cleaning, tabulation, and validation of the data to make the data accurate and consistent for analysis

Quick Insight:
Garbage In, Garbage Out (GIGO) is a commonly used rule of data scientists. Considering that the cleaning stage will involve messy or incomplete data, it will not be analyzed properly, no matter how sophisticated the algorithm is.
3. Data Analysis
It is the main step in which statistical models and machine learning algorithms, MS, and mathematical methods are used. The analyst could conduct regression analysis, clustering, classification, or a time series forecast, based on the objective. It is here that attempts are made to test hypotheses and patterns.
4. Data Interpretation And Visualization
After identification of the patterns, the analyst needs to interpret the patterns; to put the statistical results into business terms. This is where data visualization is important. Such tools as Tableau and Power BI transform complicated numbers into a digestible format of a chart and a dashboard. A good example of a data analysis report is one that is based on easy visuals.
5. Communicating Results And Taking Action
It is of no use staying on a server to do analysis. The last and most important process is the reporting of the findings (e.g., in a data analysis report example) to the stakeholders and making the suggested changes. This will be the end of the cycle, transforming insight into business value.
What Are The Key Benefits Of Data Analytics In 2025?
This is due to the fact that the popularity of Data analysitcs nowadays is determined by its direct and direct influence on the bottom line. The uses of data analysis are many; however, these are the fundamental advantages that will propel business strategy in 2025.
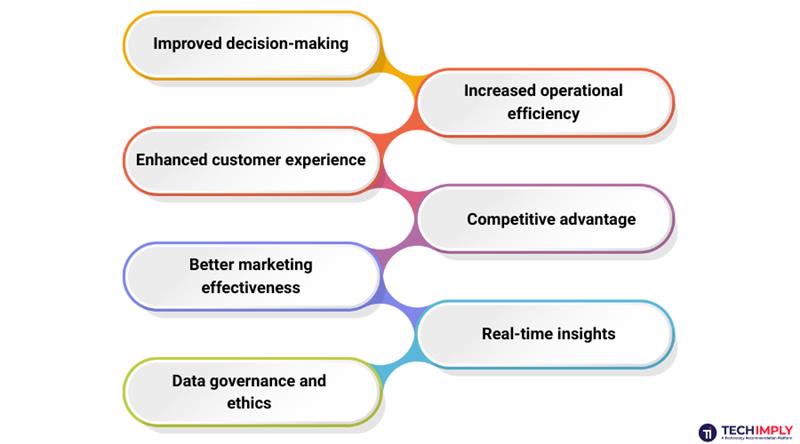
1. Improved Decision-Making
-
Fact-Based Insights
Analytics provides verifiable evidence, allowing leaders to make confident choices based on facts rather than assumptions.
-
Enhanced Forecasting
It is possible to predict the level of staffing required, as well as demand during a particular season, which will make it possible to manage, rather than respond to it.
-
Reduced Risks
Companies can prevent risks by detecting trends in terms of fraud, equipment failure, or churn of customers.
2. Increased Operational Efficiency
The data analytics applications in operations are immediately cost-saving.
-
Process Optimization
Determination of bottlenecks and unnecessary steps in work processes (e.g., manufacturing or logistics) results in leaner processes.
-
Cost Reduction
Analytics pinpoints areas of wasteful spending, from unnecessary inventory stocking to inefficient energy consumption.
-
Streamlined Supply Chains
Predictive logistics models ensure raw materials arrive precisely when needed, reducing storage costs and preventing delays.
3. Enhanced Customer Experience
This is one of the most visible data analytics examples in the consumer space.
-
Deeper Customer Understanding
The ability to analyze purchasing history, online traffic, and interaction of customers with the support team provides the business with a 360-degree picture of the customer.
-
Personalized Experiences
Analytics is used to drive personalized recommendations (e.g, Netflix or Amazon) and target messaging, which boosts engagement and conversion rates.
-
Proactive Customer Support
Predictive models have the capability of identifying the customers who will encounter a problem in the near future, and support teams will be able to make contact even before a complaint has been submitted.
4. Competitive Advantage
The most common aim of data analytics applications may be to get an advantage over competitors.
-
Early Identification Of Market Opportunities
The use of big market data assists in determining unmet market niches or rising consumer needs before other companies find them.
-
Data-Driven Innovation
Analytics also guides the research and development, making innovation focus on products and services that are actually required by the market.
5. Better Marketing Effectiveness
The study of campaign data will make sure that the maximum amount of money is spent on marketing, and which channels will provide the best ROI.
6. Real-Time Insights
The tools of today provide insights in real-time, which enables businesses to revise marketing campaigns or even shift production schedules on the fly.
7. Data Governance And Ethics
Analytics will assist in tracking data utilization and complying with ethical and compliant management of sensitive data, which is an emerging issue in 2025.
What Are The 5 Advantages Of Data Analytics?
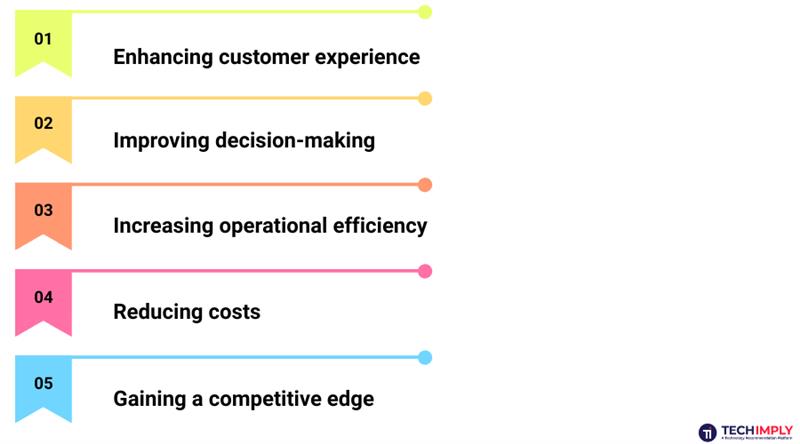
1- Enhancing Customer Experience: Building loyalty through personalization and understanding.
2- Improving Decision-Making: Replacing intuition with verified facts and forecasts.
3- Increasing Operational Efficiency: Eliminating waste and streamlining every process step.
4- Reducing Costs: Direct savings achieved through optimized processes and reduced risk.
5- Gaining A Competitive Edge: Leveraging proprietary insights that competitors lack.
Which Tools Are Commonly Used In Data Analytics?
The success of data analytics examples relies heavily on the right technical stack. Here is an overview of the most critical tools used for data analysis in 2025, detailing theiruse cases and features.
1. Spreadsheets (E.G., Microsoft Excel, Google Sheets)
Spreadsheets are often the starting point for every analyst, student, or business owner exploringng insights from raw data. Despite being simple, Excel and Google Sheets remain among the most widely used tools for data analysis. They help in storing data, applying formulas, visualizing insights using charts, and building quick dashboards without coding.
Features:
- Basic to moderate statistical functions
- Simple charting and visualization
- Pivot tables
- Easy to share
- Real-time collaboration (Sheets)
Pros:
- Easy to use
- Affordable
Cons:
- Limited automation
- Not scalable for huge datasets
Pricing: Free–₹600/month depending on version.
2. Big Data Tools
Hadoop and Spark are the backbone of large-scale data analytics applications — capable of processing terabytes to petabytes of data across distributed computer systems. When businesses collect real-time data from IoT devices, user behaviour logs, sensors, or transactional systems, spreadsheets are not enough. That’s when big data tools take over.
Features:
- Handles petabytes of data
- Distributed computing
- Fast processing
- Compatible with cloud systems
- Fault tolerant
Pros:
- Ideal for large enterprises
- Highly scalable
Cons:
- Requires technical skills
- High initial setup
Pricing: Free (open-source) + Infrastructure cost.
3 . Data Mining Software (E.G., Rapidminer, Knime)
RapidMiner and KNIME specialize in advanced analytic workflows such as data mining, clustering, predictive modeling, and machine learning. These tools are popular in data analysis in research, academic projects, marketing automation, and decision-making environments that need quick pattern discovery.
Features:
- Drag & drop workflow
- Predictive analysis
- ML model development
- Automated reporting
- Integrates with Python/R
Pros:
- Easy visual interface
- Good for non-coders
Cons:
- Can be slow with large datasets
- Paid plans expensive
Pricing: Free version available | Paid starts ~₹4,000/month
4 . Tableau
Tableau is one of the most powerful data visualization tools used for data analysis worldwide. Instead of reading raw rows of data, Tableau turns them into meaningful dashboards, interactive charts, and real-time analytics visuals that help leaders make decisions at a glance. If your goal is storytelling, reporting, KPI tracking, or trend interpretation, Tableau is a frontrunner.
Features:
- Real-time dashboards
- Drag-and-drop visuals
- Mobile accessibility
- Cloud + On-prem support
- Multiple data source integration
Pros:
- Beautiful visualizations
- Great for storytelling
Cons:
- Costly for individuals
- Requires learning time
Pricing: Starts from ₹5,000–₹7,000/month.
5. Python
Python stands as a dominant powerhouse in applications of data analysis — widely used in AI, automation, machine learning, and predictive forecasting. It offers limitless customization, making it suitable for everything from cleaning messy data to building neural networks and advanced forecasting engines.
Features:
- Supports ML / AI libraries
- Data cleaning & transformation
- Real-time analytics
- Automation of repetitive tasks
- Strong community support
Pros:
- Extremely powerful
- Free & open source
Cons:
- Requires coding knowledge
- Steeper learning curve
Pricing: Completely free.
Pro-tip
If you are aiming for a career in advanced analytics in 2025, focus on mastering Python (for modeling and automation) and Tableau (for visualization and communication). This combination is often listed as the top requirement for a data analysis definition career path.
Conclusion
From customer preferences to market shifts, from marketing performance to risk management, analytics empowers businesses with clarity. The more data you analyze, the better decisions you make. And as these data analytics examples prove, industries using analytics are scaling faster than those relying on intuition intuition.
With the right tools, a clear process, and a commitment to data culture, your business is capable of smarter decisions, higher profits, and long-term growth.
This is the future, and the future is data-driven.